Analyzing a stock means answering a question that sounds simple: at its current price, does this stock offer a good balance between the risk taken and the return expected? The difficulty is not finding information — it is everywhere — but ranking it and combining it without being trapped by a single figure. This guide details a complete method, across five dimensions, to move from a mass of data to a clear, reasoned decision.
Why is a single indicator never enough?
It is the most common mistake: looking for the magic indicator. The P/E, the RSI, the latest quarterly result… taken in isolation, each has a modest directional accuracy, around 55 to 65%. That is barely better than a coin toss.
The strength of a good analysis does not come from one exceptional signal, but from the convergence of several independent signals. When three axes that do not measure the same thing point in the same direction, accuracy rises to roughly 70-78%. With four or more aligned axes, it reaches 75-82%. The goal is therefore not to find the perfect indicator, but to build cross-confirmation.
The key word is independent: aligning three indicators that all measure momentum adds almost nothing, because they say the same thing. Aligning earnings, financial quality and valuation — three genuinely different angles — brings real robustness.
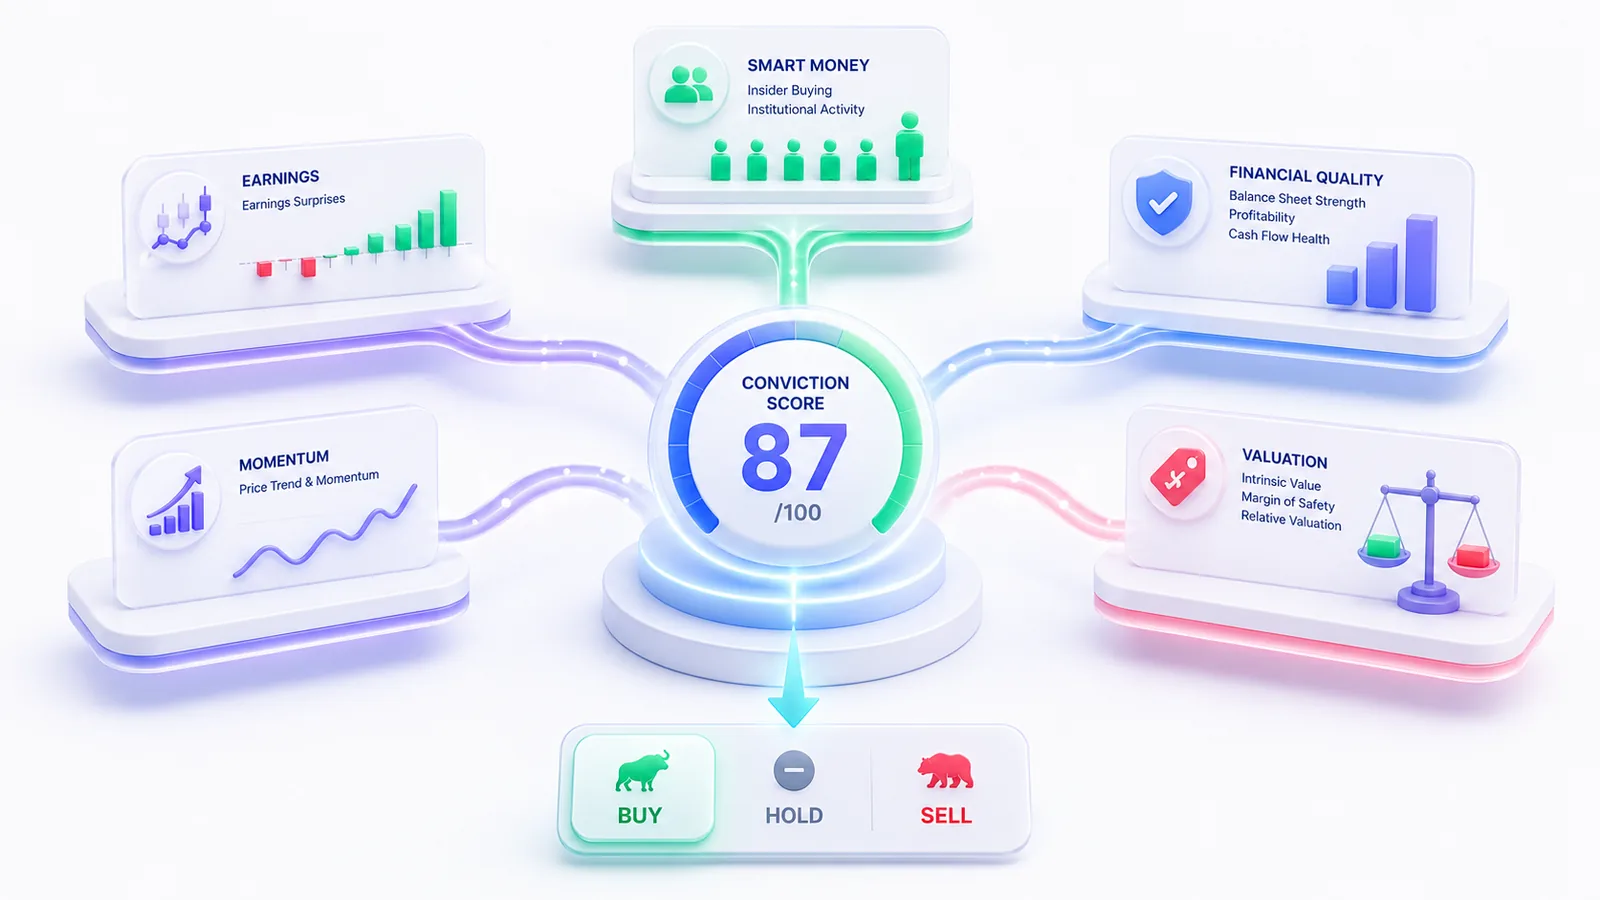
What are the 5 dimensions to analyze?
A complete analysis rests on five families of signals, chosen precisely because they are weakly correlated with one another and cover different time horizons.
The weights are not arbitrary: the most predictive short-term signals (earnings, momentum) weigh more, while valuation — very reliable long term but poor for timing — weighs less. Let us examine them one by one.

Dimension 1 — Earnings: is the company keeping its promises?
Quarterly results are the most direct signal of a company's operating health. Three elements matter.
First, earnings surprises: does the company beat the analyst consensus, and by how much? A company that exceeds expectations several quarters in a row (a "serial beater") sends a signal of management quality and conservative guidance. Conversely, two consecutive missed quarters are a red flag.
Next, the direction of analyst revisions: are future earnings estimates rising or falling? Upward revisions often precede a rise in the share price. Beware of thinly covered stocks, though: a revision based on two analysts is worth less than a consensus of fifteen.
Finally, the date of the next results: just before a release, uncertainty is at its peak. A buy signal three days before a quarter is more fragile than the same signal six weeks out.

Dimension 2 — Momentum: what is the market saying?
Momentum captures price dynamics — a stock's tendency to continue its move. It is one of the most robust signals over a 3-to-6-month horizon, provided it is read correctly.
The underlying measure is 12-month performance excluding the last month: it captures the long trend without being trapped by short-term reversals. It is confirmed with moving averages: when the 50-day average crosses above the 200-day (the "golden cross"), the underlying trend is bullish.
Two safeguards complete the reading. The RSI measures whether the stock is overbought or oversold: the ideal zone is between 55 and 70; beyond 75, the risk of a reversal rises. The ADX measures the strength of the trend, not its direction: a golden cross in a directionless market (low ADX) is worth far less than a golden cross confirmed by a high ADX.

Dimension 3 — Smart money: what are those in the know doing?
No one knows a company better than its own executives. When they buy their own shares with their own money, the market listens — and rightly so.
The strongest signal is insider buying over a rolling 90-day window. It is weighted by the buyer's rank (a purchase by the CEO or CFO weighs far more than one by a middle manager) and by recency. Several executives buying at the same time form a "cluster buying," a particularly powerful signal.
Be careful: insider sales are ambiguous (taxes, diversification, a property purchase) and should almost never trigger a decision on their own. We complement this with US Congress transactions, publicly disclosed, which add a layer to the smart-money picture — particularly relevant in defense, healthcare and energy.

Dimension 4 — Financial quality: can the thesis hold?
Financial quality is what lets you keep a position over time without nasty surprises. Three benchmark academic scores form a powerful filter.
The Piotroski F-Score rates financial health across 9 criteria (profitability, leverage, efficiency). A score of 7-9 indicates a solid company; below 3, fragility dominates. In a good method, it acts as a conviction multiplier rather than a simple added point: an excellent thesis on a fragile company must be penalized.
The Altman Z-Score estimates bankruptcy risk: above 3, safe zone; below 1.8, distress. The Beneish M-Score detects likely accounting manipulation. These two mainly serve as safeguards: they rule out dangerous cases even before you look at the price.
We add two measures of capital efficiency: ROIC (a company that durably creates value shows ROIC above 15%) and FCF yield (the ability to generate free cash).

Dimension 5 — Valuation: is the price reasonable?
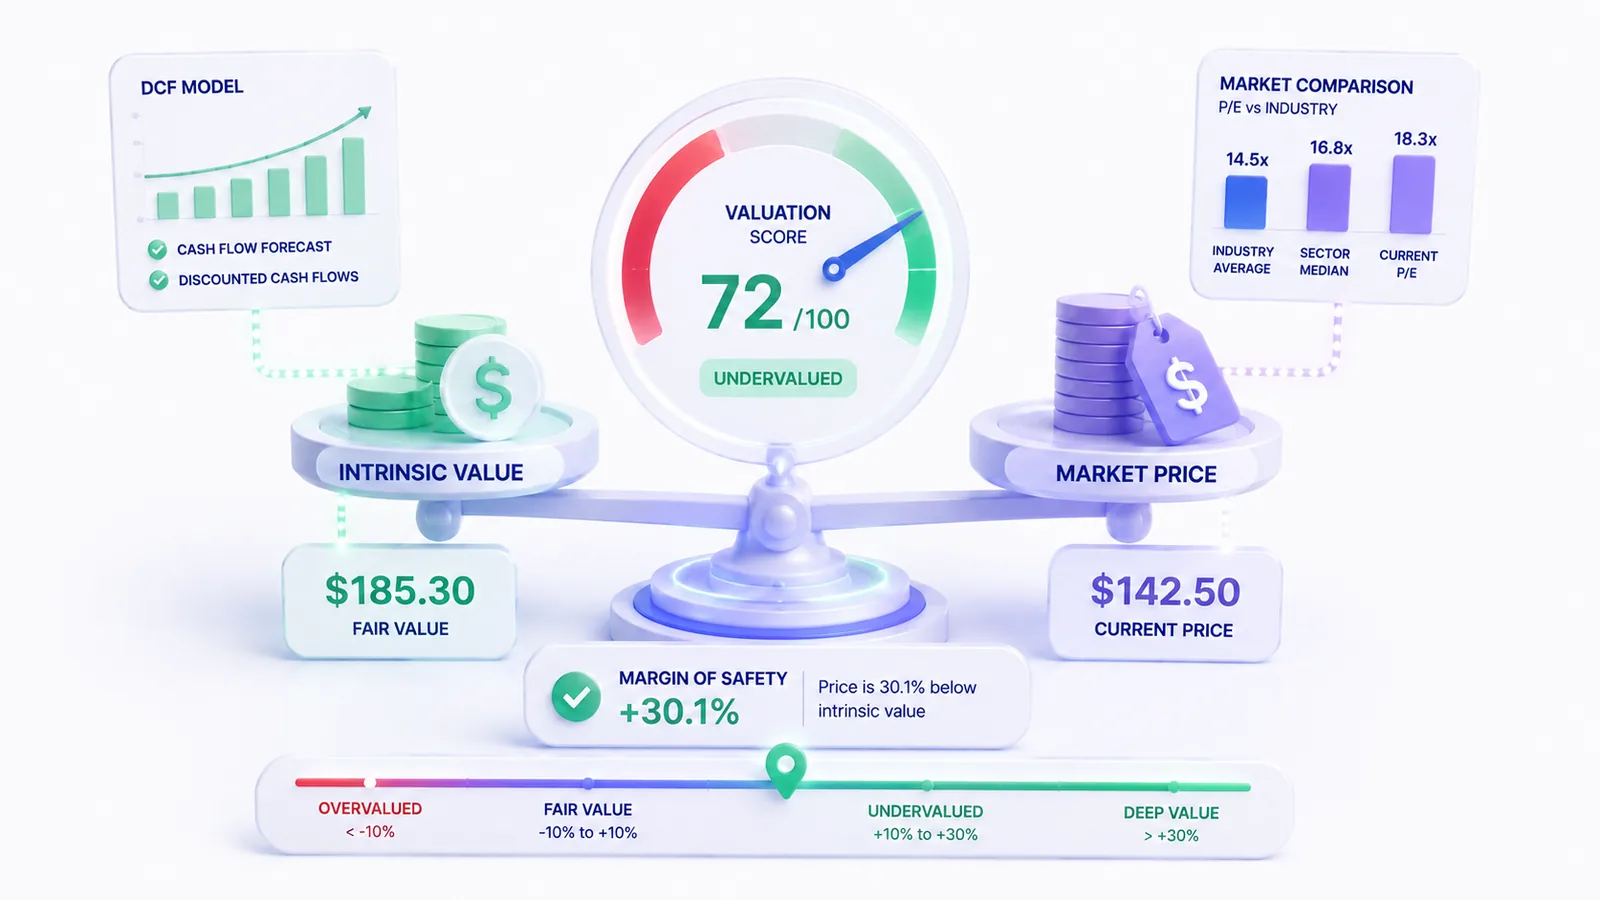
Valuation is the weakest signal in the short term — an expensive stock can stay expensive for quarters — but the most reliable in the long term. It serves less to time than to measure the margin of safety.
Three angles complement each other. The P/E compared to the sector: a P/E only makes sense relative to its peers and the stock's history, never in absolute terms. The EV/EBITDA compared to the 5-year history: is the stock expensive or cheap relative to its own past? And the upside from a DCF: the gap between the estimated intrinsic value and the current price.
The classic trap is the "value trap": a stock that looks cheap because the market is anticipating — often rightly — a deterioration. That is why valuation is never read alone, but always against quality and earnings.
How to combine the five dimensions?
This is the step that separates amateur analysis from rigorous analysis. You do not blindly average the five scores: you look for convergence and explicitly handle contradictions.
A solid buy is confirmed across several axes: good earnings + positive momentum + high quality + reasonable valuation. When the signals align, conviction is strong. When they contradict each other — for example excellent quality but excessive valuation, or strong momentum on a fragile company — it is not a case to decide, but a case to watch.
Concretely, you aggregate the five weighted dimensions into a single conviction score from 0 to 100, applying the quality multiplier. This figure is not a truth: it is a transparent synthesis you can break down dimension by dimension.
From analysis to decision: buy, sell or hold
The conviction score translates into a signal through thresholds set in advance — which neutralizes emotion at the moment it is most dangerous.
But the score is not enough: a genuine buy requires confirmation conditions — decent earnings, undeteriorated quality, no bankruptcy risk, next results more than a few days away. And a sell never triggers on a single weak signal: it takes a deterioration confirmed across several axes.

Mistakes to avoid
A few pitfalls recur constantly. Overweighting a single axis — falling in love with a low P/E while ignoring deteriorating quality. Confusing purchase price with value — selling or holding based on your unrealized gain, which has no informative value. Ignoring the earnings calendar — buying on the eve of a high-risk release. Forcing a decision when signals are mixed, when doing nothing is often the best option.
A method, not a crystal ball
No method guarantees being right on every stock. What a rigorous multi-signal analysis guarantees is making decisions for the right reasons, reproducibly, and knowing exactly what would invalidate the thesis. That is precisely what InvestIQ automates: a 0-100 conviction score computed across these five dimensions, a BUY/SELL/HOLD verdict, and the detail of the bull and bear arguments — so that you keep control of the interpretation.
This is not investment advice.