
Analyzing a stock means answering three questions in order: what does the company do, and does it earn a good living from it; are its accounts sound; and what does today's price already assume about its future. The method below follows seven steps, each with its primary sources, the article that goes deeper and a free tool. It describes how to analyze; it does not say what to do with any particular stock.
The seven steps at a glance
| Step | The question | Where to look | Going further |
|---|---|---|---|
| 1. The business | What does the company sell, to whom, and where does it make money? | Annual report (10-K, universal registration document) | Company financials |
| 2. Earnings quality | Do growth and margins turn into cash? | Income statement, cash flow statement | ROIC, FCF yield |
| 3. Balance sheet strength | Are the accounts improving? Can the balance sheet absorb a shock? | Balance sheet, debt, maturities | Piotroski, Altman |
| 4. What the price implies | What growth is already built into today's price? | Price, P/E, cash flows | Reverse DCF, P/E |
| 5. What changed | Results against expectations, revisions, insider trades | Earnings releases, insider filings | Insiders |
| 6. The trend | What does the price trend say, and what doesn't it say? | Price history | Momentum |
| 7. The thesis | Why this company, and what would change my mind? | Your notes, your portfolio | Deciding with rules, portfolio analysis |
Step 1 — Understand the business
Before any ratio, you need to know what the company sells, to whom, in which countries, and how much of its revenue comes from each activity. The reference source is the annual report: the 10-K for a US company, free on EDGAR, the SEC's database, and the universal registration document for a French company, published on its website and on info-financiere.gouv.fr. Read these parts first: the business description, the risk factors and the segment information (revenue and profit by activity).
Three questions are enough for a first pass: where most of the revenue comes from; whether customers come back on their own (subscriptions, contracts, consumables) or have to be won again every year; and what would stop a competitor from doing the same thing for less. The SEC publishes a guide on how to read a 10-K.
For large US companies, our company financials pages show ten fiscal years of figures taken from the 10-K filings, with a link to each filing.
Step 2 — Check the quality of earnings
Revenue growth only counts if it turns into profit, then into cash. Over five to ten years, look at:
- revenue growth, and whether it comes from volumes, prices or acquisitions;
- the operating margin: stable, rising or under pressure;
- free cash flow against net income: profit that does not show up in cash, year after year, needs an explanation (swelling inventories, customers paying later, heavy investment);
- ROIC, the return on invested capital, compared with the cost of that capital: it tells you whether growth creates value (ROIC explained).
A dated benchmark: among the 481 non-financial companies in the universe InvestIQ follows, the median ROIC was 9.4% on 7 November 2026, and 46% were above 10% (stock market statistics).
Step 3 — Check financial strength
Two academic scores give a quick first check from the published accounts alone.
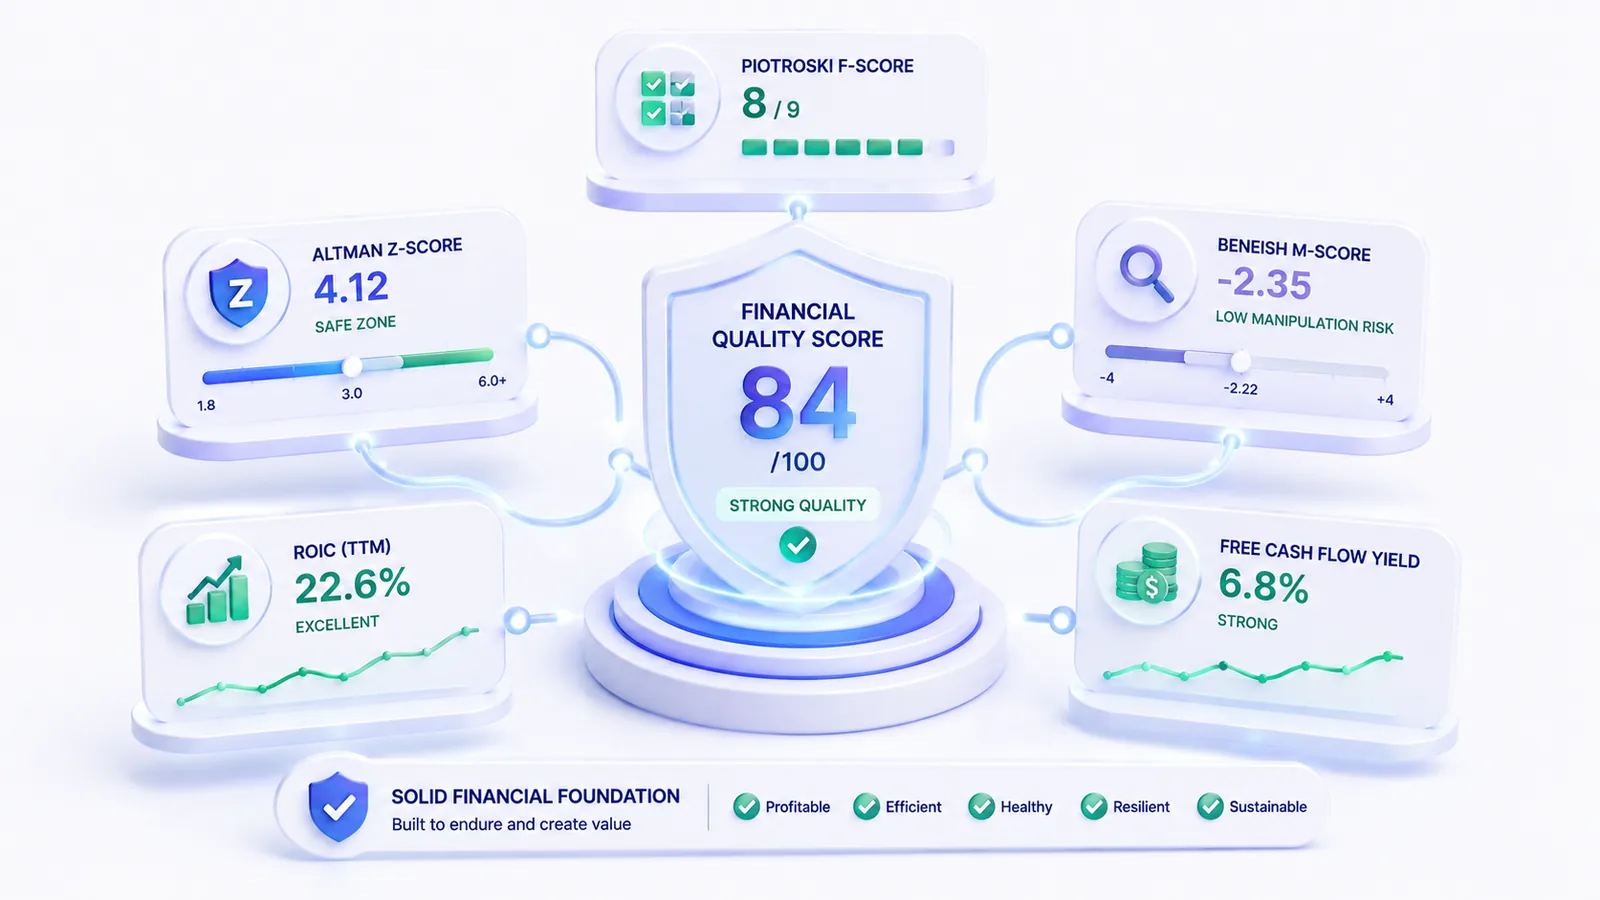
- The Piotroski F-Score (Piotroski, 2000, Journal of Accounting Research) adds up nine tests on profitability, leverage and efficiency: 7 to 9 points to accounts improving on most fronts, 0 to 3 to accounts getting worse. On 7 November 2026, 52% of the 481 non-financial companies in our universe scored 7 or more, and 4% scored 3 or less. → The Piotroski F-Score
- The Altman Z-Score (Altman, 1968, Journal of Finance) combines five ratios to estimate the risk of default: above roughly 3, the safe zone; below 1.8, the distress zone. Built on industrial companies, it reads poorly for banks, insurers and companies that buy back a lot of stock. On the same date, 21% of these non-financial companies were in the distress zone. → The Altman Z-Score
Then read the balance sheet directly: net debt relative to EBITDA, and above all the maturity schedule. High debt coming due while rates rise does not weigh the same as long-dated fixed-rate debt.
Step 4 — Understand what the price implies
A good company is not a good investment at any price. Rather than asking whether a stock is "expensive", it is more useful to ask what its price already assumes.
- The P/E ratio (price ÷ earnings per share) only means something against its sector and the company's own history. On 7 November 2026, the median P/E in our universe was 23.6: 13.6 for financials, 31.3 for technology; 9% of companies had no positive P/E (P/E by sector). → The P/E ratio explained
- A reverse DCF starts from the price and solves for the cash-flow growth needed to justify it. If that growth is well above anything the company has achieved so far, the price is already counting on a lot of good news. → Reverse DCF calculator
- A DCF goes the other way: from your assumptions for growth, margins and discount rate, it estimates a value. The result depends mostly on the terminal value and the rate; move the rate by one point and the value moves a lot, which is why you should always look at the sensitivity. → DCF calculator, intrinsic value
For equity risk premiums and cost of capital by sector, Aswath Damodaran's data (NYU Stern), updated every year, is the most widely used reference.
The classic trap is the "value trap": a stock with a low P/E because the market expects, often rightly, earnings to fall. That is why step 4 is never read without steps 2 and 3.
Step 5 — Look at what changed
Annual accounts describe the past; three sources tell you what has moved since.
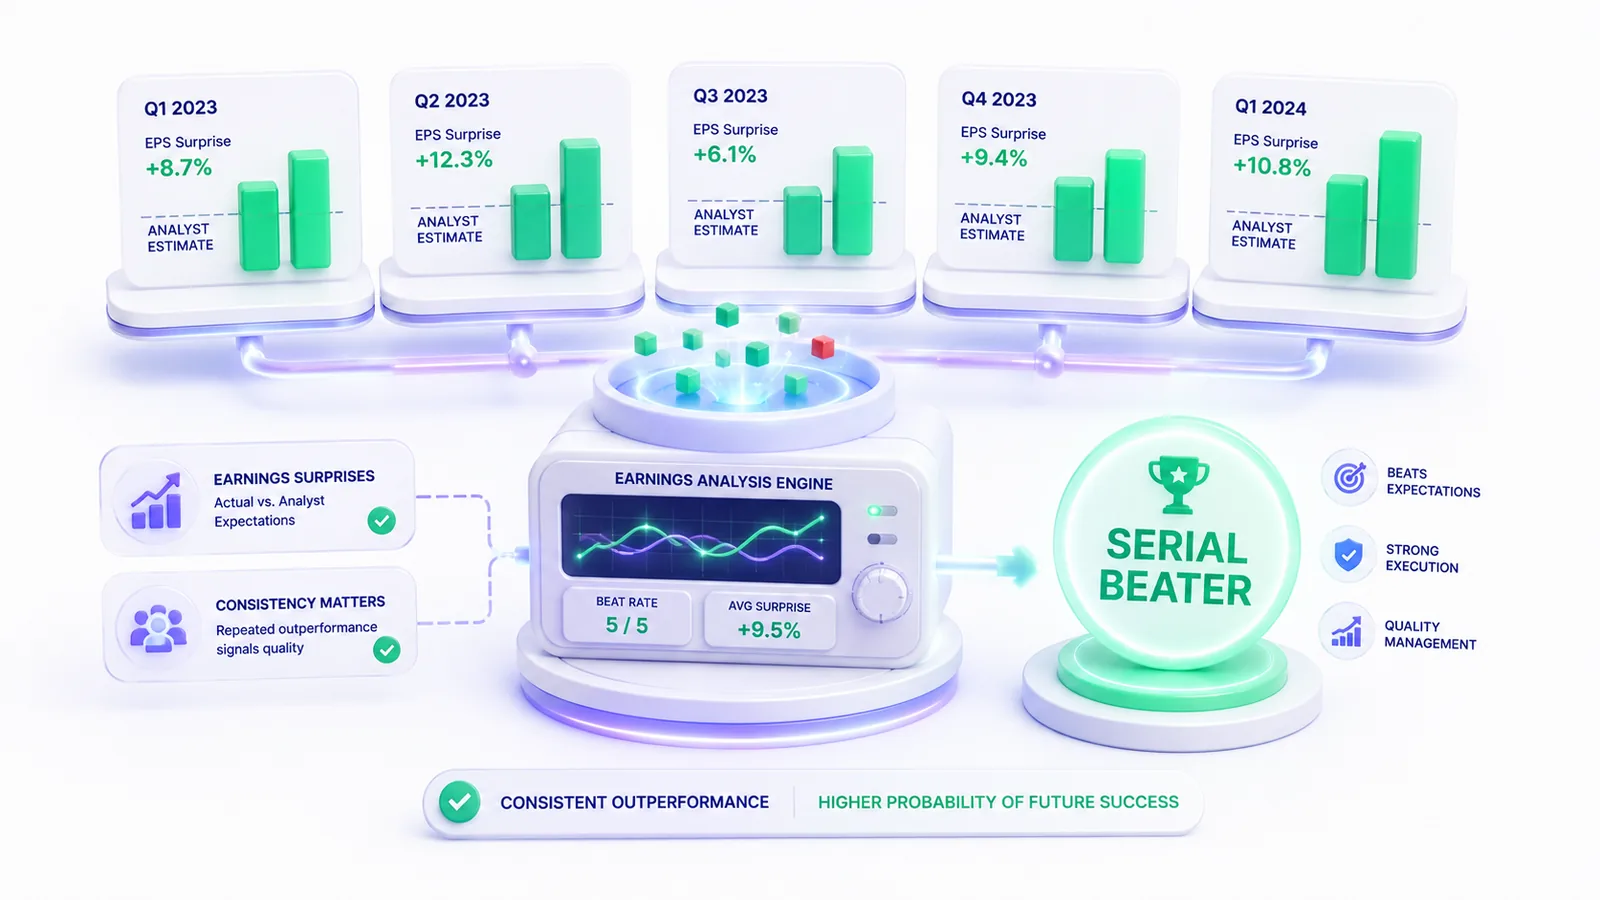
- Results against expectations. A company that beats the analyst consensus several quarters running sends a different message from one that disappoints twice in a row. Look at management's guidance and how it changes, too.
- Estimate revisions. The direction in which analysts revise their earnings forecasts often says more than the level. A revision driven by two analysts weighs less than a consensus of fifteen.
- Insider trades. In the US, executives report them to the SEC on Form 4 within two business days; in France, they are published in the AMF's BDIF database. An executive buying on the open market with their own money (code P on Form 4) says more than a share award or a pre-planned sale. → Following insider trades
Step 6 — Read the price trend
The price trend says nothing about what the company is worth, but it does say what the market is doing. The most studied measure is twelve-month momentum excluding the last month (Jegadeesh and Titman, 1993, Journal of Finance): over three to twelve months, the stocks that had risen most tended, on average, to keep going, with sharp reversals possible.
Moving averages (50 and 200 days) and the RSI help place a stock within its trend; they do not predict the next move. Use them as context, for instance so as not to mistake a quality company for a stock that has been falling for a year for good reasons. → Momentum, RSI and moving averages

Step 7 — Write the thesis, and what would break it
An analysis is finished only when it fits in a few written lines: why this company, which figures support it, and above all what would change your mind (a margin that falls two quarters running, debt that crosses a threshold, a key executive leaving). Setting these criteria before you need them saves you from reinventing them in the heat of the moment. → Deciding with rules set in advance
Then comes the stock's place in the portfolio: the same stock does not weigh the same in a five-line portfolio and in a forty-line one. Concentration, sectors and currencies matter as much as the analysis of each holding. → Diversification and risk management, portfolio analysis
Combining the steps without blind averaging
No single indicator is enough: a low P/E can hide a deteriorating business, a strong rally can rest on fragile results. The method works through the convergence of independent angles. Three measures of the same thing (three momentum indicators, say) add almost nothing to one; improving results, sound accounts and a price that does not assume unrealistic growth confirm each other.
When the steps contradict each other (excellent quality but a price that assumes growth the company has never reached, or a strong rally on deteriorating accounts), the contradiction is not something to settle quickly: it is the question to dig into.
Common mistakes
- Stopping at one number, a low P/E or spectacular growth, without looking at the rest.
- Confusing the price you paid with value: your purchase price says nothing about what the company is worth today.
- Ignoring the calendar: just before an earnings release, uncertainty is at its highest.
- Taking a description for a forecast: a score, a ratio or a trend describes data on a date; none of them announces tomorrow's price.
- Not writing the thesis down: without criteria set in advance, every new piece of information becomes a reason to change your mind, or never to change it.
What InvestIQ automates, and what it doesn't
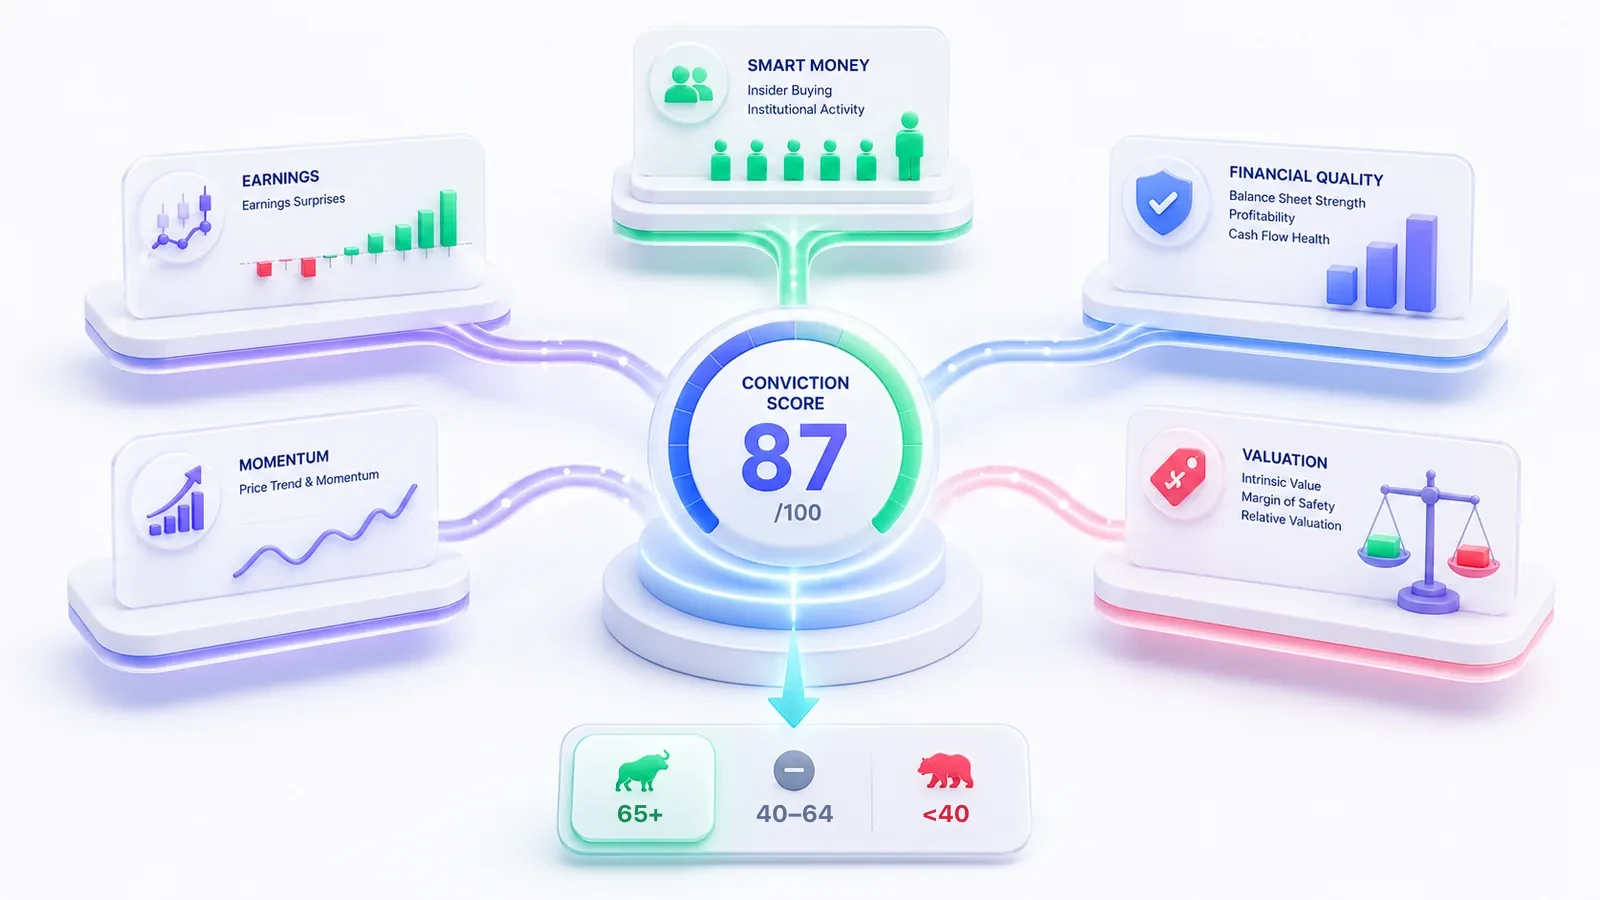
In InvestIQ, a stock analysis computes these families of data with a deterministic engine (results, price momentum, insider trades, quality of the accounts, valuation) and sums them up in a score from 0 to 100, read as a rank within a universe of about 600 stocks; the methodology publishes the weights and thresholds. The AI explains these figures in plain language; it computes none of them. Neither the score nor the AI decides for you: step 7 stays yours. → What is a conviction score?
Educational guidance only, not investment advice.
Tools and data for this topic
- Company financialsTen years of revenue, profit and free cash flow for 25 large US companies, each figure linked to its 10-K.
- Reverse DCF calculatorStart from the share price and find the growth it already assumes. Free, no account.
- Stock market statistics by sectorMedian P/E, free cash flow yield, ROIC and Piotroski scores by sector across about 600 companies, updated monthly.
Frequently asked questions
A first pass (the business, five years of figures, balance sheet strength, what the price implies) can take one to two hours with the annual report and free tools. An in-depth analysis that reads the notes, the competitors and several years of quarterly results takes much longer.
They answer different questions. Fundamental analysis describes the company and what its price assumes; technical analysis describes the price trend. The first helps you understand what you own, the second gives context; neither predicts the price with certainty.
Yes. Annual reports are free (EDGAR for US companies, info-financiere.gouv.fr and company websites in France), and InvestIQ's DCF, reverse DCF and intrinsic value calculators work without an account.
Five benchmarks give a first picture: revenue growth over five years, the operating margin, free cash flow compared with net income, net debt relative to EBITDA, and the P/E compared with the sector median.
After every earnings release and every event that touches a criterion of the thesis (an acquisition, a key executive leaving, a sharp rise in debt). In between, a review on a fixed date, quarterly for instance, avoids reacting to every move in the price.
